Trace viewer to debug snapshots
Trace viewer lets you explore network requests, console logs, and other debugging information captured during the snapshot process. It helps you pinpoint the root cause of rendering issues, such as missing fonts, incorrect styles, or unexpected layout changes.
Chromatic records traces automatically. When a test is unstable, Chromatic flags it and attaches a trace of the capture session. Builds containing unstable tests include a Traces column with one trace link per enabled browser. Click a browser to open its trace.
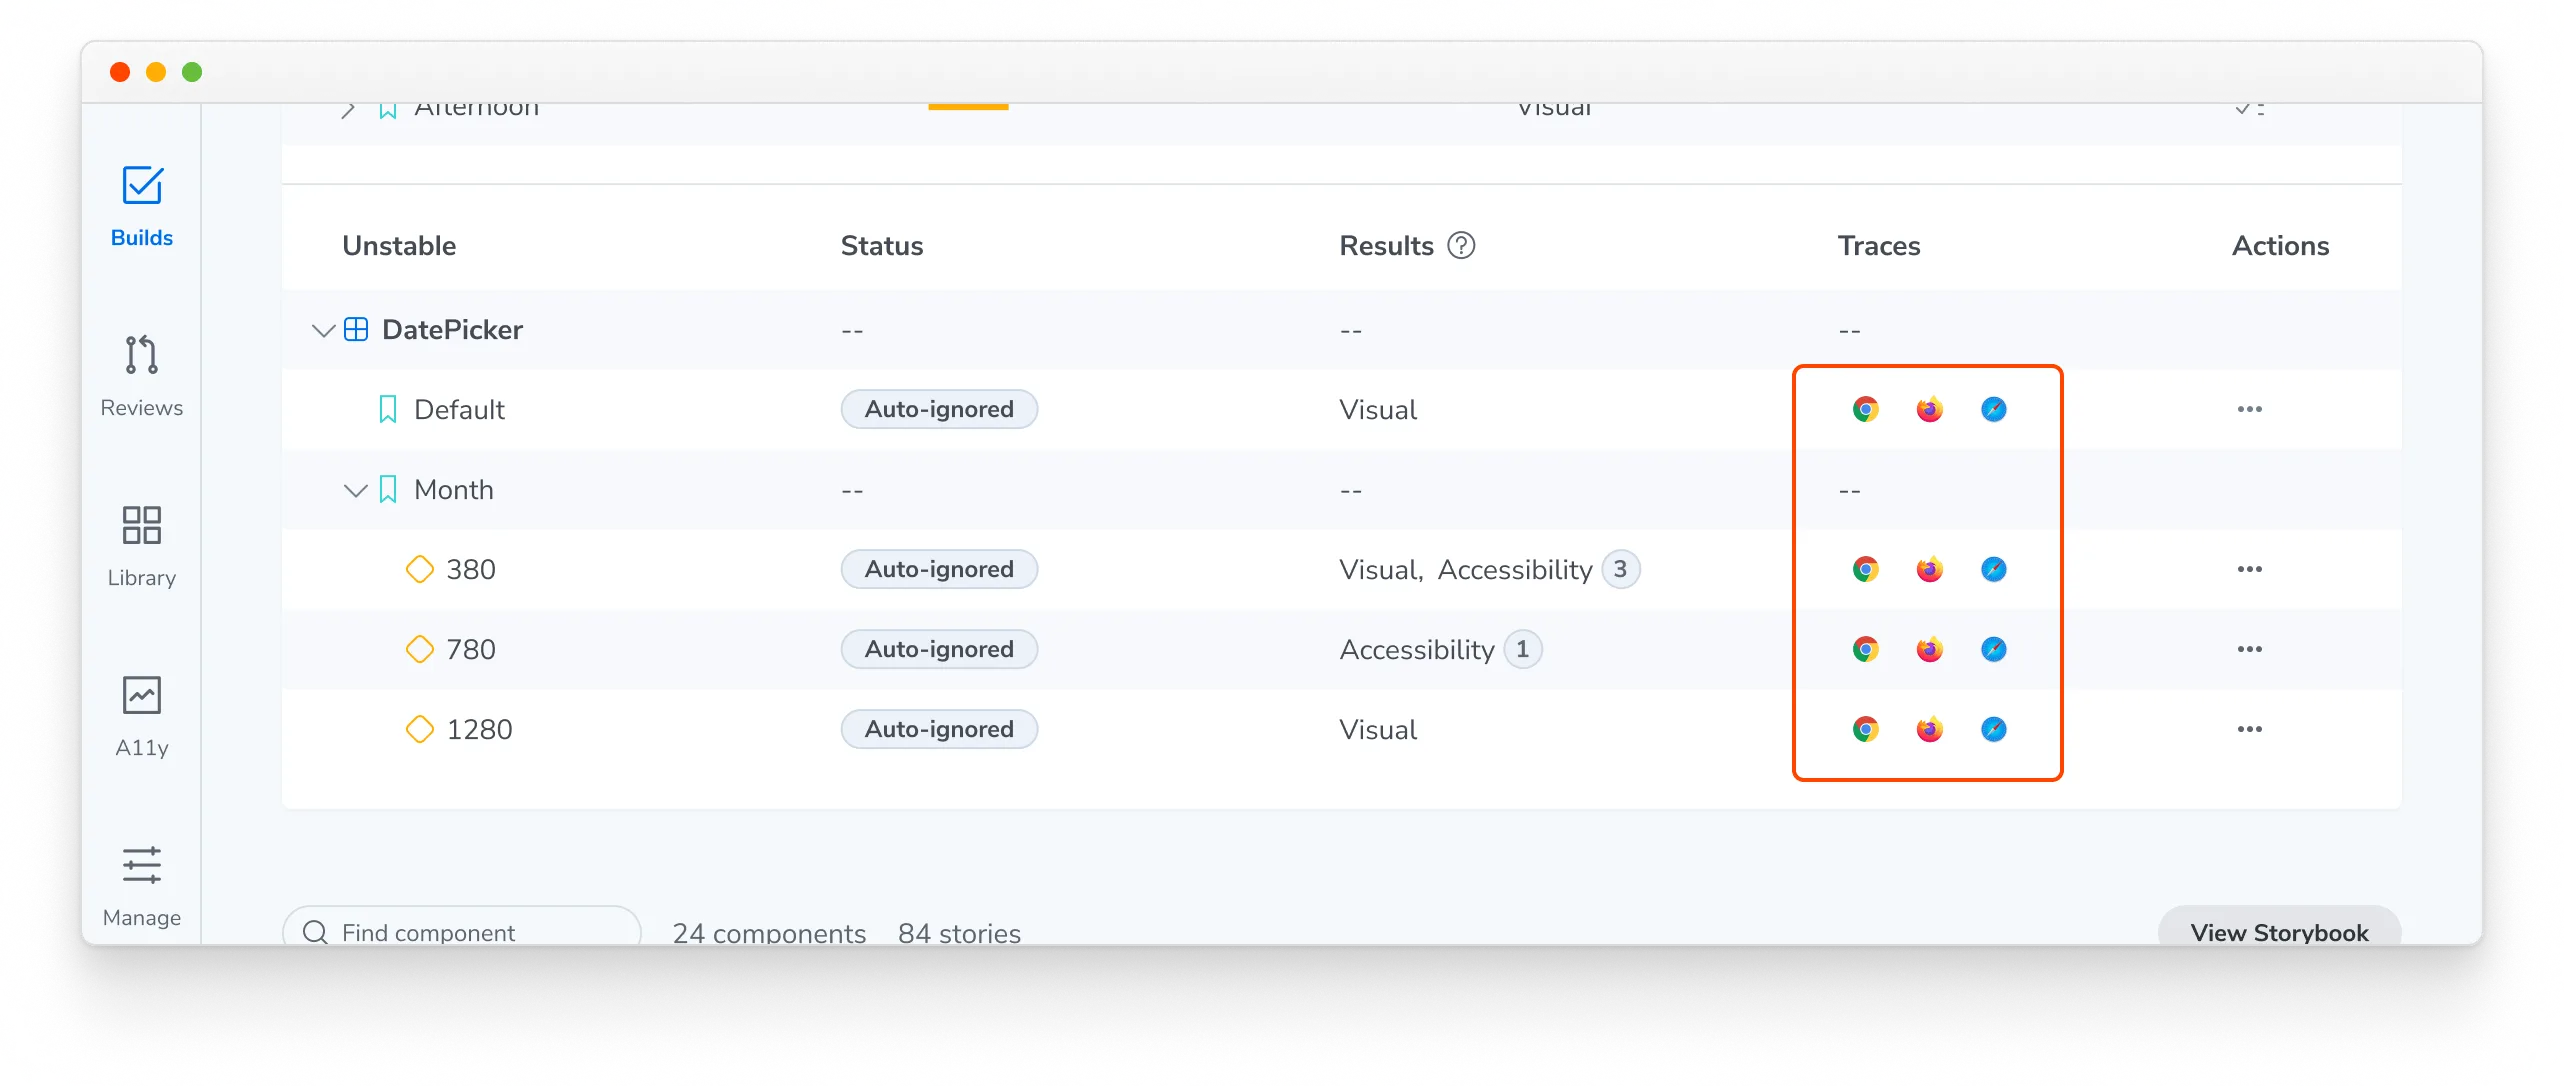
How to use a snapshot trace
Chromatic uses Playwright to render and capture snapshots in Capture Cloud, even if your tests are written using Vitest, Cypress, or Storybook. This lets Chromatic use Playwright’s trace viewer features to record network activity, console logs, DOM snapshots, and other debugging information.
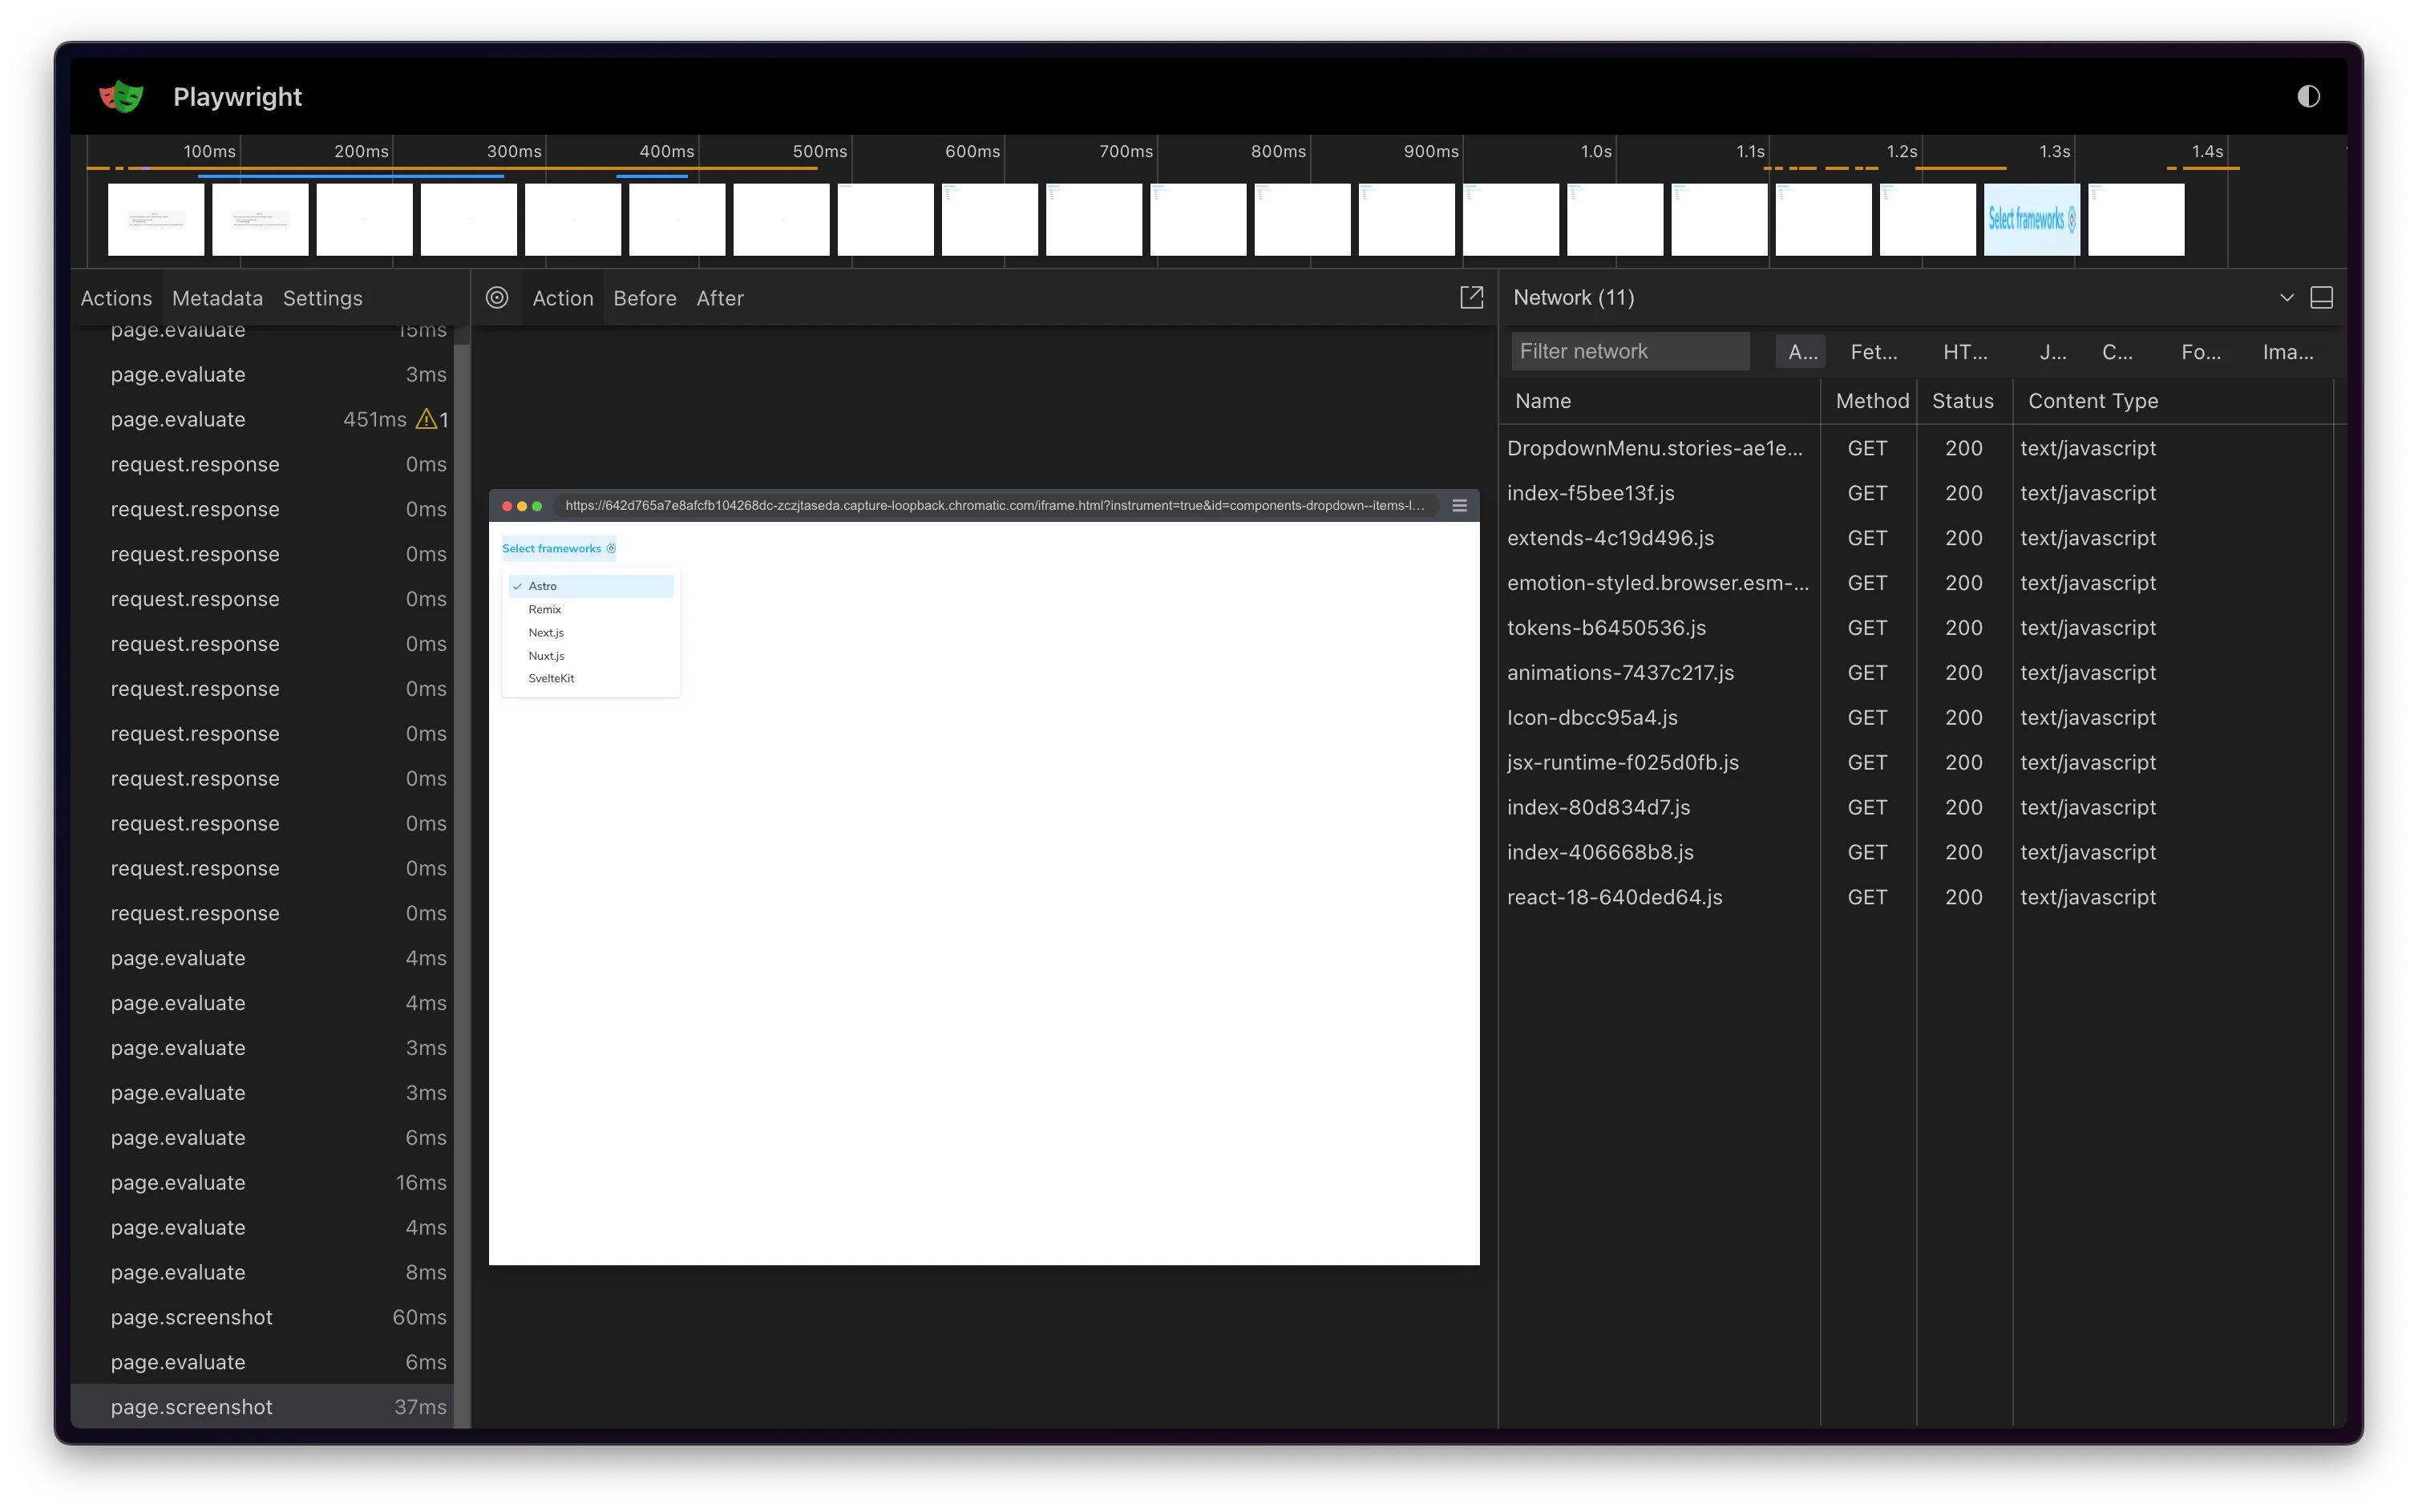
Below are some common scenarios where the trace viewer can help you debug snapshot issues:
Network tab analysis
The network tab displays the resources loaded during capture, including fonts, stylesheets, scripts, and other assets. Check for resources that failed to load or took a long time. For example, if fonts are incorrect or styles are missing, ensure that the font or CSS files loaded successfully with the correct MIME type. Learn how to make resource loading more reliable.
For a detailed list, see Playwright’s trace viewer features.
Inspect the DOM
The trace archives the DOM for each step or action executed, allowing you to inspect the DOM at the time of capture. Use this tab to verify the DOM structure is as expected.
Check for missing elements, incorrect styles, or unexpected layout changes. If styles are missing but the CSS file has loaded, ensure the styles are applied correctly.
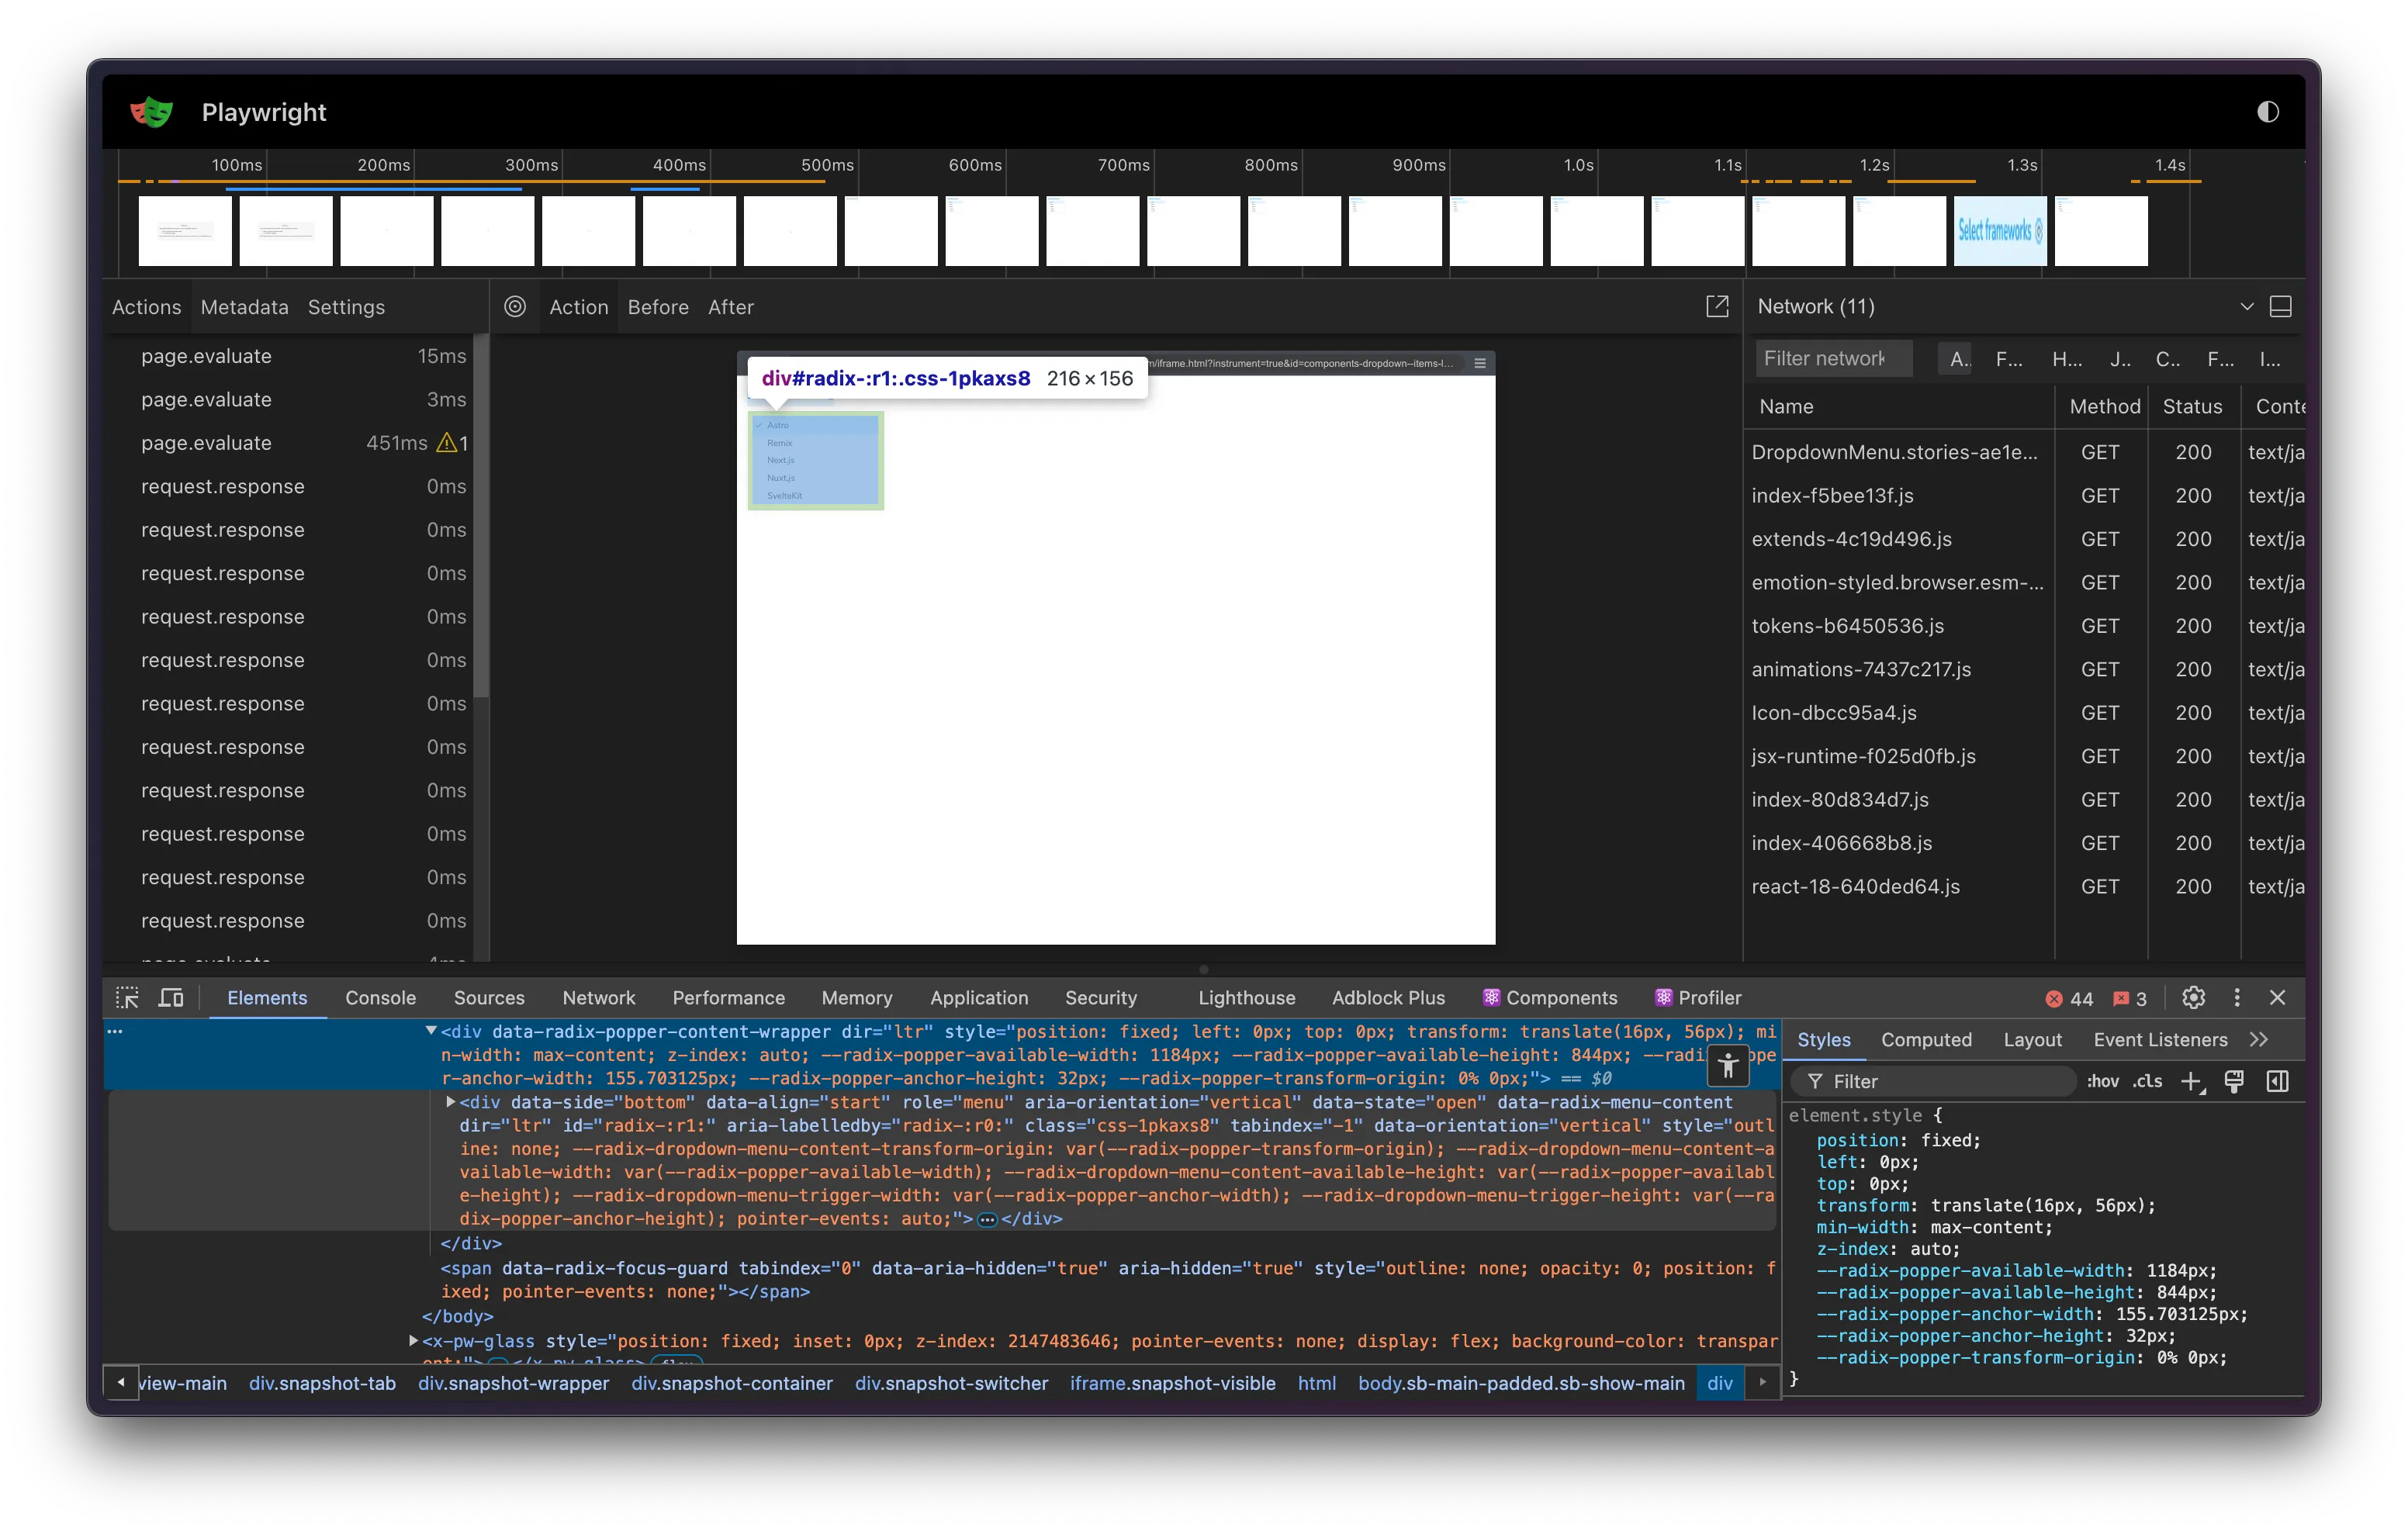
Snapshot metadata
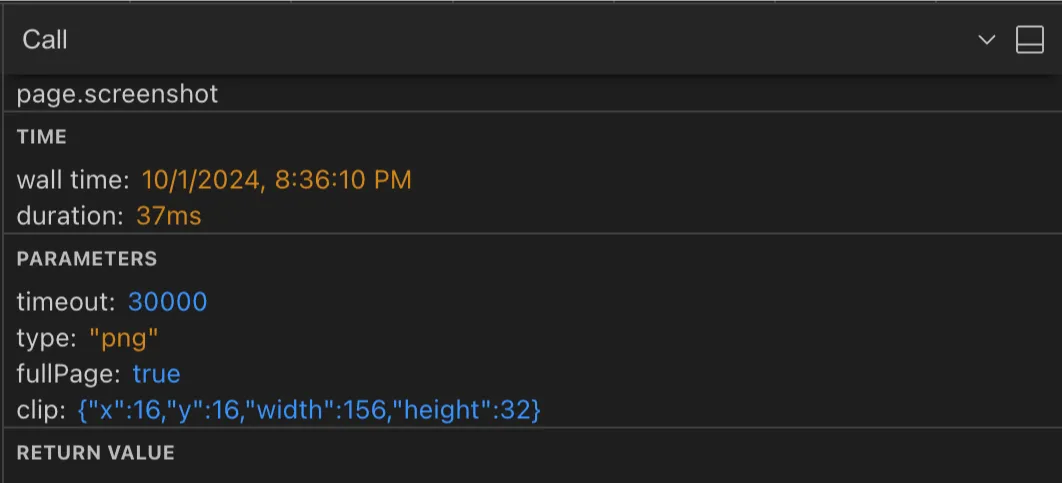
When Chromatic captures a snapshot, it includes metadata like viewport information and clip rectangle dimensions. Use this data to identify issues such as:
- Responsive design issues: Viewport information reveals the screen size used for the capture. Compare this with your breakpoints to ensure that the correct styles are applied.
- Element positioning problems: The clip rectangle shows precisely what was captured. If an element is missing from the snapshot, verify if it falls within the expected clip area.
Fix the root cause
Instability is a signal that a test needs attention. Once the trace has helped you identify why a test is unstable, learn how to improve test stability with fixes such as pausing animations, preloading fonts, and seeding randomness.
If the trace shows a failed interaction, work through the step-by-step method to debug failing interaction tests.